8 Business understanding
In business understanding, you:
- Define your (business) goal
- Frame the problem (regression, classification,…)
- Choose a performance measure
- Show the data processing components
First of all, we take a look at the big picture and define the objective of our data science project in business terms.
In our example, the goal is to build a classification model to predict the type of median housing prices in districts in California. In particular, the model should learn from California census data and be able to predict wether the median house price in a district (population of 600 to 3000 people) is below or above a certain threshold, given some predictor variables. Hence, we face a supervised learning situation and should use a classification model to predict the categorical outcomes (below or above the preice). Furthermore, we use the F1-Score as a performance measure for our classification problem.
Note that in our classification example we again use the dataset from the previous regession tutorial. Therefore, we first need to create our categorical dependent variable from the numeric variable median house value. We will do this in the phase data understanding during the creation of new variables. Afterwards, we will remove the numeric variable median house value from our data.
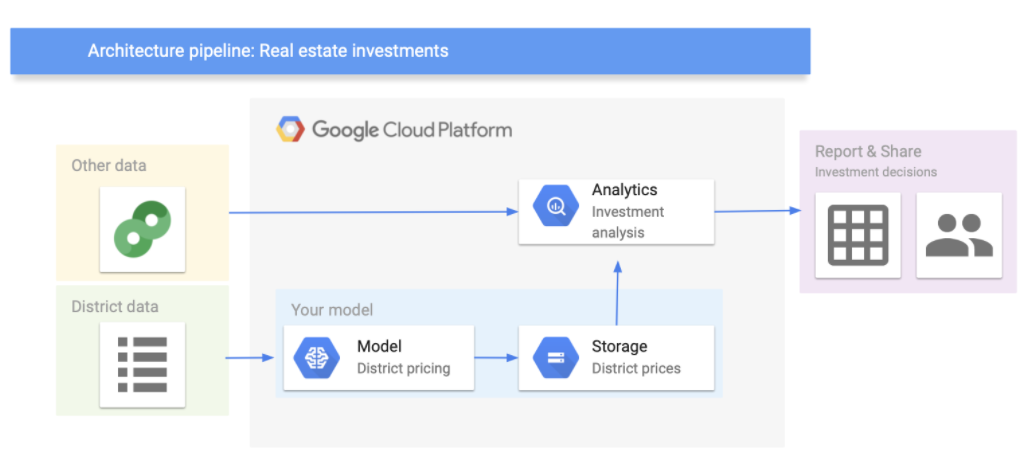
Let’s assume that the model’s output will be fed to another analytics system, along with other data. This downstream system will determine whether it is worth investing in a given area or not. The data processing components (also called data pipeline) are shown in 8.1 (you can use Google’s architectural templates to draw the data pipeline).

Figure 8.1: Data processing components